

*Edit, 2019. Sadly, the technology used to produce the interactive map has since been shut down by Google.
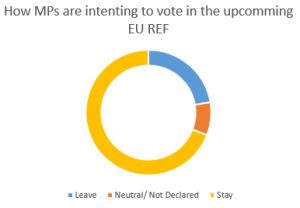
There are 649 MPs currently sitting in the House of Commons (One seat is currently vacant), that is 649 locally influential people whom in the coming months will do their best to persuade their constituents on which way to vote in the upcoming European Referendum. As of March 21st, there are 145 MPs intending to vote leave, 1 neutral (the speaker), 55 MPs not declared, and 448 MPs intending to vote to remain part of the European Union.
As a percentage: 22.3% of MPs wish to leave, 8.62% neutral/ Not declared, and 69% intending to remain.
However, what I wanted to know was what this distribution looked like on a geographic map of the United Kingdom. So I created the Map below, areas in red signifies a constituency where the incumbent MP wishes to leave the EU; Blue are areas where the MP wishes to remain; Grey is undecided; and yellow is N/A or Neutral.
As the map is interactive, you should be able zoom in and out, move around, and can click on each constituency for more information.
The map shows nothing we didn’t expect already. Scotland and Wales overall want to stay in the EU. Meanwhile the majority of MPs who which to leave are in the the more rural areas of England, again no surprise. What this map shows the most is the position of NI MPs, which remains interestingly ambiguous.
The above map was created in Google Fusion using data from the Ordnance Survey manipulated in ArcMap, with supplemental data taken from MapIT:UK for the incumbent MP/ party data. The MPs vote intention was taken from the BBC’s latest article. I won’t lie, it was a complete bitch to make: I had to take something called a KML file from the OS data, import it into another format for ArcMap, use a tool to simplify the data (Google had size limits), then export it back out to a KML file, use Notepad++ to remove all the meta data & header data from the file, before finally importing it into Google. I had to do that 650 times, once for each constituency.
Overall I am happy knowing I learnt how to collect all the data, and display it in the below map in under two days. Furthermore I can use the collected map data to make more maps! Hopefully my supervisor doesn’t find out what I’ve been spending my time on.